


When a product that used to sell well slows down, the cause usually sits in one of three places: it shows up less in search results, it shows up but gets fewer clicks, or it gets clicked but convinces fewer shoppers than the competition. If your brand is enrolled in Brand Registry, the Search Query Performance dashboard in Brand Analytics shows you which one. For each search that leads to your catalogue, up to 1,000 of them, it puts the whole market's numbers next to your product's. The stage where your share drops is the one to fix.
Before you rewrite the listing
Faced with a drop, the usual reaction is to rewrite the title and bullet points with new keywords. But if the product is as visible as before and loses shoppers on the page, new keywords change nothing. And if you edit the title, images and price in the same week, you will not know which change worked when the numbers move. Start from the data and change one thing at a time.
What the dashboard shows
You open the dashboard from Brand Analytics in Seller Central. According to Amazon's help page it is limited to users with the brand representative role in Brand Registry. If you get a message saying you are not authorised to access the page, the account's primary administrator can grant you Brand Analytics permissions from the Global User Permissions page. The main data:
- Brand view: one row for each query associated with your catalogue, up to 1,000. How many you see depends on the size of your catalogue
- ASIN view: the same metrics for a single product, which you enter in the ASIN field
- Query details: in the ASIN view, click a query to see the 10 best-performing ASINs on that search, compared with the selected ASIN
- Reporting range: weekly, monthly or quarterly. A week runs from Sunday to Saturday, as the report's technical documentation states
- For each query: Search query volume, then the four stages of the funnel: impressions, clicks, basket adds and purchases. For each stage you get the Total count across all products shown for that search, the Brand count, meaning your brand's number, and the Brand share, meaning your share. In the ASIN view the count and share refer to the selected ASIN
- Price and delivery: the median price of the products clicked, added to the basket and purchased, for the whole market and for your brand, and how many clicks, basket adds and purchases go to products with same-day, one-day or two-day shipping. When the dashboard opens you only see the Same-day shipping speed column: you add Price (median), Brand price (median), 1D shipping speed and 2D shipping speed from Customise columns
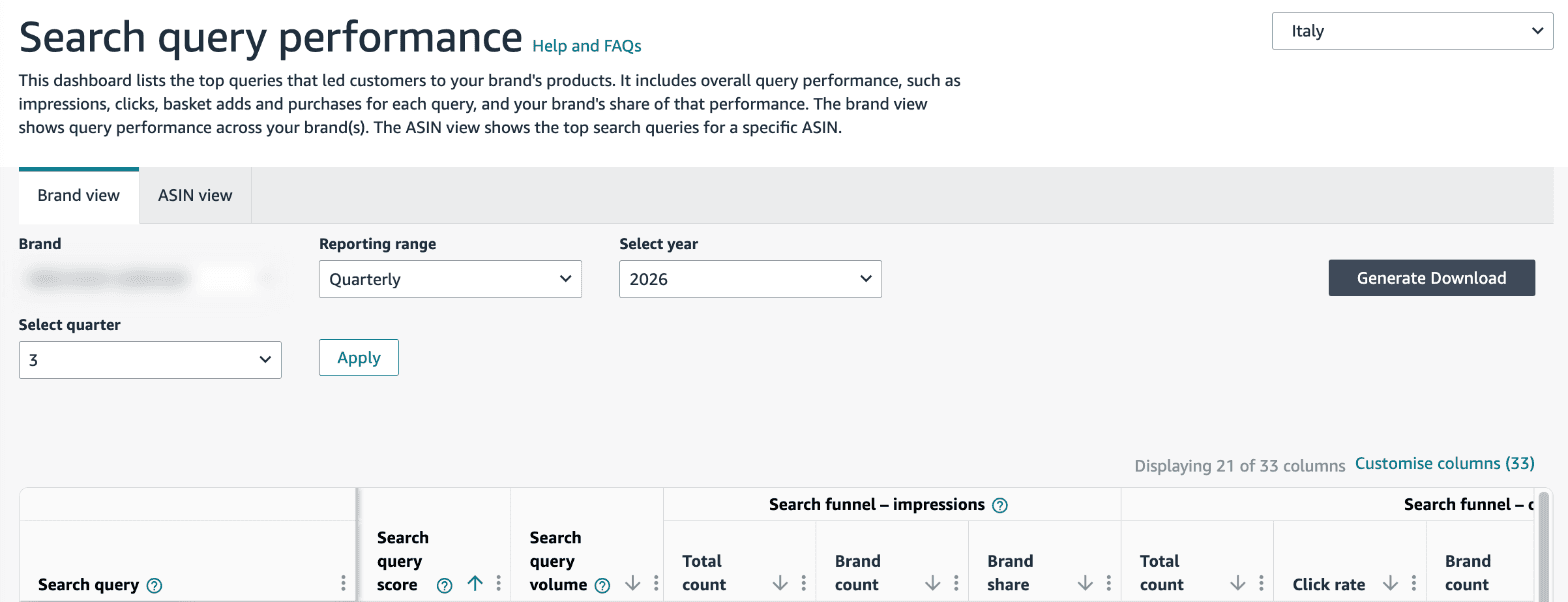
The table has two kinds of percentage. Click rate, Basket add rate and Purchase rate are calculated on search volume, meaning how many times the term was searched, not on impressions or clicks. Brand share is your share of that stage. To see how many clicks turn into purchases, divide purchases by clicks yourself.
How to read it: three comparisons
Pick the 10 to 20 queries that drove the most sales before the drop and look at your ASIN on each. Ask three questions, in this order.
- Do shoppers see you as often as before? Compare your Brand share of impressions with previous periods on the same query. If it falls, the problem is visibility
- Do they click you as much as they see you? Put your share of clicks next to your share of impressions. If it is lower, your search result attracts fewer shoppers than the others
- Do the people who click buy? Put your share of purchases next to your share of clicks. If it is lower, shoppers who open your page buy less often than the average for that search
An example. On one query the market gets 200,000 impressions, 8,000 clicks and 1,200 purchases. Your ASIN gets 6,000 impressions, 300 clicks and 24 purchases: 3% of impressions, 3.75% of clicks, 2% of purchases. Shoppers pick you in the results more than average, but you convert 8% of clicks against the market's 15%. The work is on the page and the offer, not on keywords.
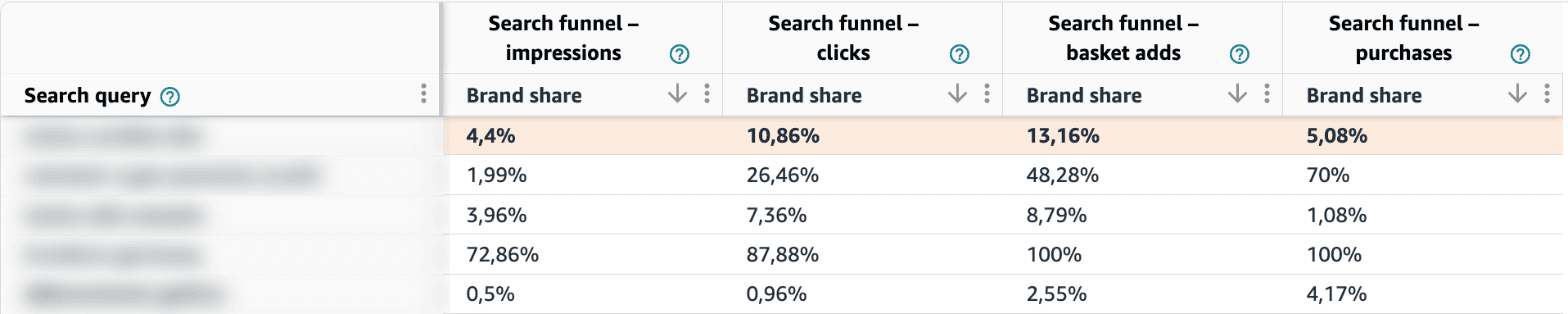
Here is what it looks like on real data. In the screenshot, taken from a real account for July to September 2026, we kept only the Brand share columns for the four stages. On the first query the brand has 4.4% of impressions, 10.86% of clicks and 13.16% of basket adds, but only 5.08% of purchases: shoppers pick it in the results more than average, then it loses them between the basket and the purchase. The last row shows the opposite: 0.5% of impressions and 4.17% of purchases, so shoppers who find the product buy it, but few of them find it. In both cases the brand's purchases are in single figures, so before acting, check that the same pattern shows up in other periods.
What to do in each case
If shoppers see you less
- Check your advertising: the dashboard counts both organic results and Sponsored Products. A smaller budget or a lower bid on that term cuts impressions even if the listing has not changed
- Check stock and the featured offer: a product that is out of stock, or whose featured offer has moved to another seller, loses space in results and ads
- Check the term is still in the listing: edits to the title, bullet points or search terms, even ones made to fix a compliance warning, may have removed the very words that drove sales. If you need a term and the rules allow it, put it back in a listing field
If shoppers see you but click less
- Main image: it is the first thing a shopper sees in the results. Compare it with the products that beat you on the same search
- Price: on clicks, compare Brand price (median) with Price (median), meaning your median price against the market's. If you sit well above it, expect fewer people to pick you in the results
- Ratings and delivery: the number of reviews, the stars and the delivery date shown all affect the click. The Same-day shipping speed and 1D shipping speed columns tell you whether shoppers on that search mostly click products with fast delivery: if you do not offer it, that may be one of the reasons
If shoppers click but buy less
- Open Query details: the 10 best-performing ASINs for that search tell you who you are losing to. Compare price, review count, images and variations
- Reread the page on a phone: secondary images, bullet points and A+ Content should answer a buyer's doubts, not list keywords
- Check recent reviews: a defect mentioned several times in recent weeks can lower conversion before the star average changes. Our guide on how to manage Amazon reviews covers how to read and answer them
In all three cases change one thing at a time, then compare the same query week on week. That way you know what moved the numbers and can decide whether to keep it.
The limits of the data
- Search results page only: Amazon counts organic results and Sponsored Products but excludes traffic from sections such as "Top rated" or "New arrivals". Sales that come from other routes do not show up here
- Different numbers from advertising: Amazon warns that these metrics should not be compared with those in the advertising console or other dashboards, because they attribute shopper actions differently
- The dash: a "-" value means the data is not available for that period
- Queries with small numbers: with a few dozen clicks, one purchase more or less is enough to move the percentages. For these queries pick a monthly or quarterly reporting range, or group similar searches together
- The long tail: with a maximum of 1,000 queries per brand, the rarer searches may not appear
For the content side, our guide on how to optimise product listings covers title, bullet points and images; to see who is beating you, read the one on competitor analysis. Amazon also explains its search dashboards in its Brand Analytics guide. If you want to read this data on your own catalogue with people who work on Amazon SEO every day, let's talk.